← The Paper Trail

What Waiting Actually Buys

Five cameras, each held between six and sixteen years. One lost nearly half its value. One made eight times over. The rest landed everywhere in between — and that spread is the finding.

Glass Hound · 29 August 2026

In December 2008, a Contax with an ivory finish sold in Vienna for €11,400. It came back to the same rooms sixteen years later and made €9,600.

A Tower 46 bought for €840 in 2007 returned a decade later and made €480.
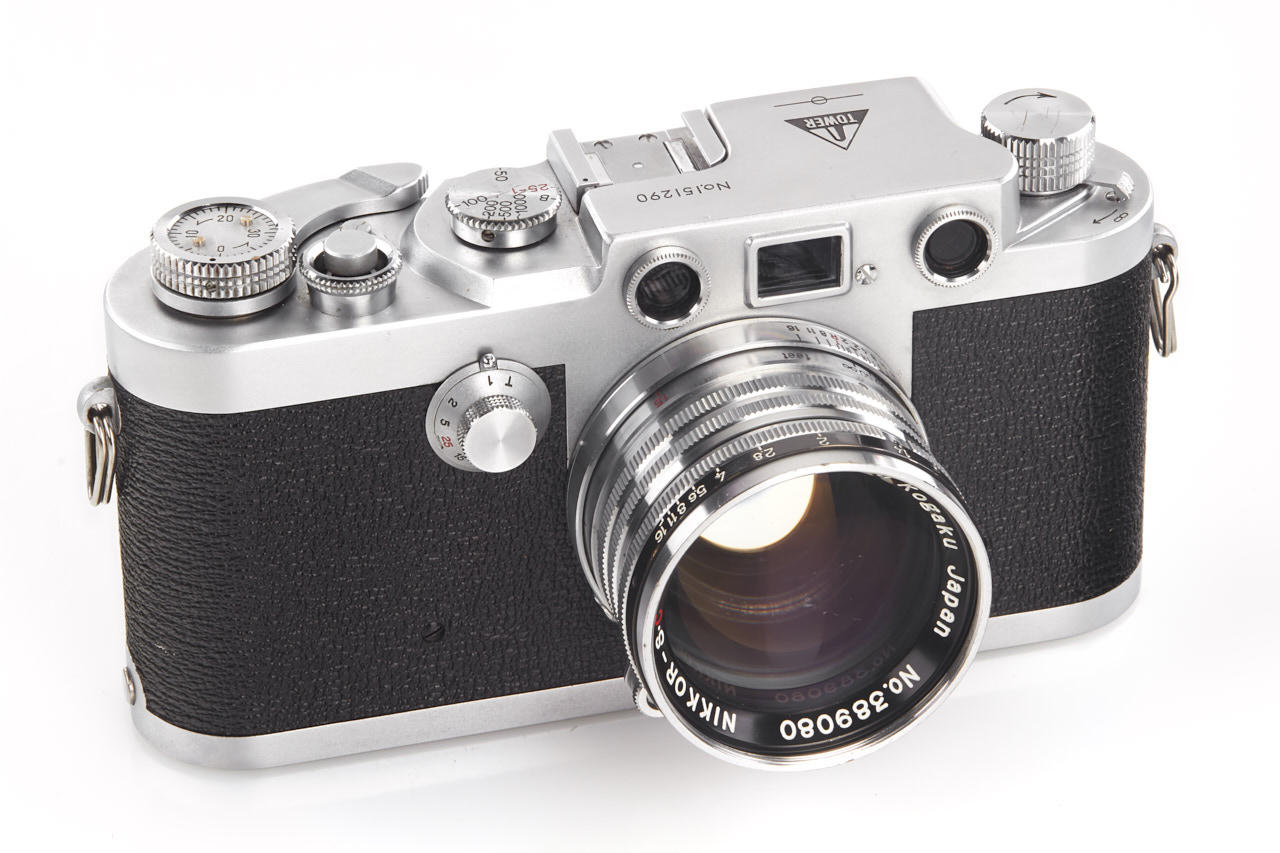
A Tower 46, €840 in 2007. A decade later it made €480
A Tower 46, €840 in 2007. A decade later it made €480Leitz Photographica

A Steinheil Casca II outfit bought for €2,400 in 2009 sold in 2015 for €2,400. Six and a half years, to the euro.
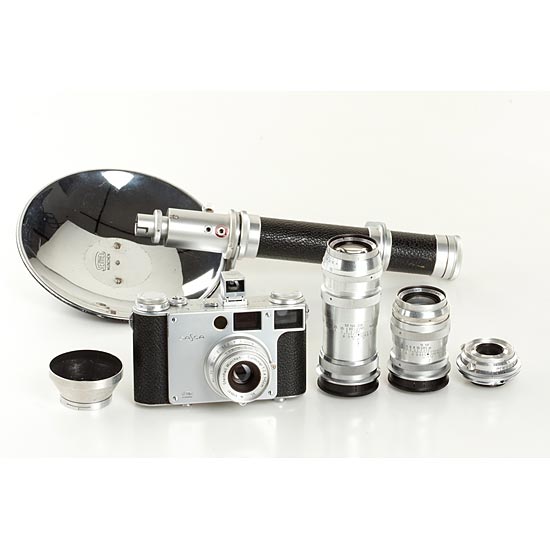
The Steinheil Casca II outfit that sold for €2,400 in 2009. Six and a half years later it made exactly the same.
The Steinheil Casca II outfit that sold for €2,400 in 2009. Six and a half years later it made exactly the same.Leitz Photographica

A Hugo Meyer Trioplan bought for €360 in 2006 made €900 eight years later.

And a Taylor-Hobson Cooke Anastigmat, bought in 2014 for €1,320, came back a decade later at €10,800.
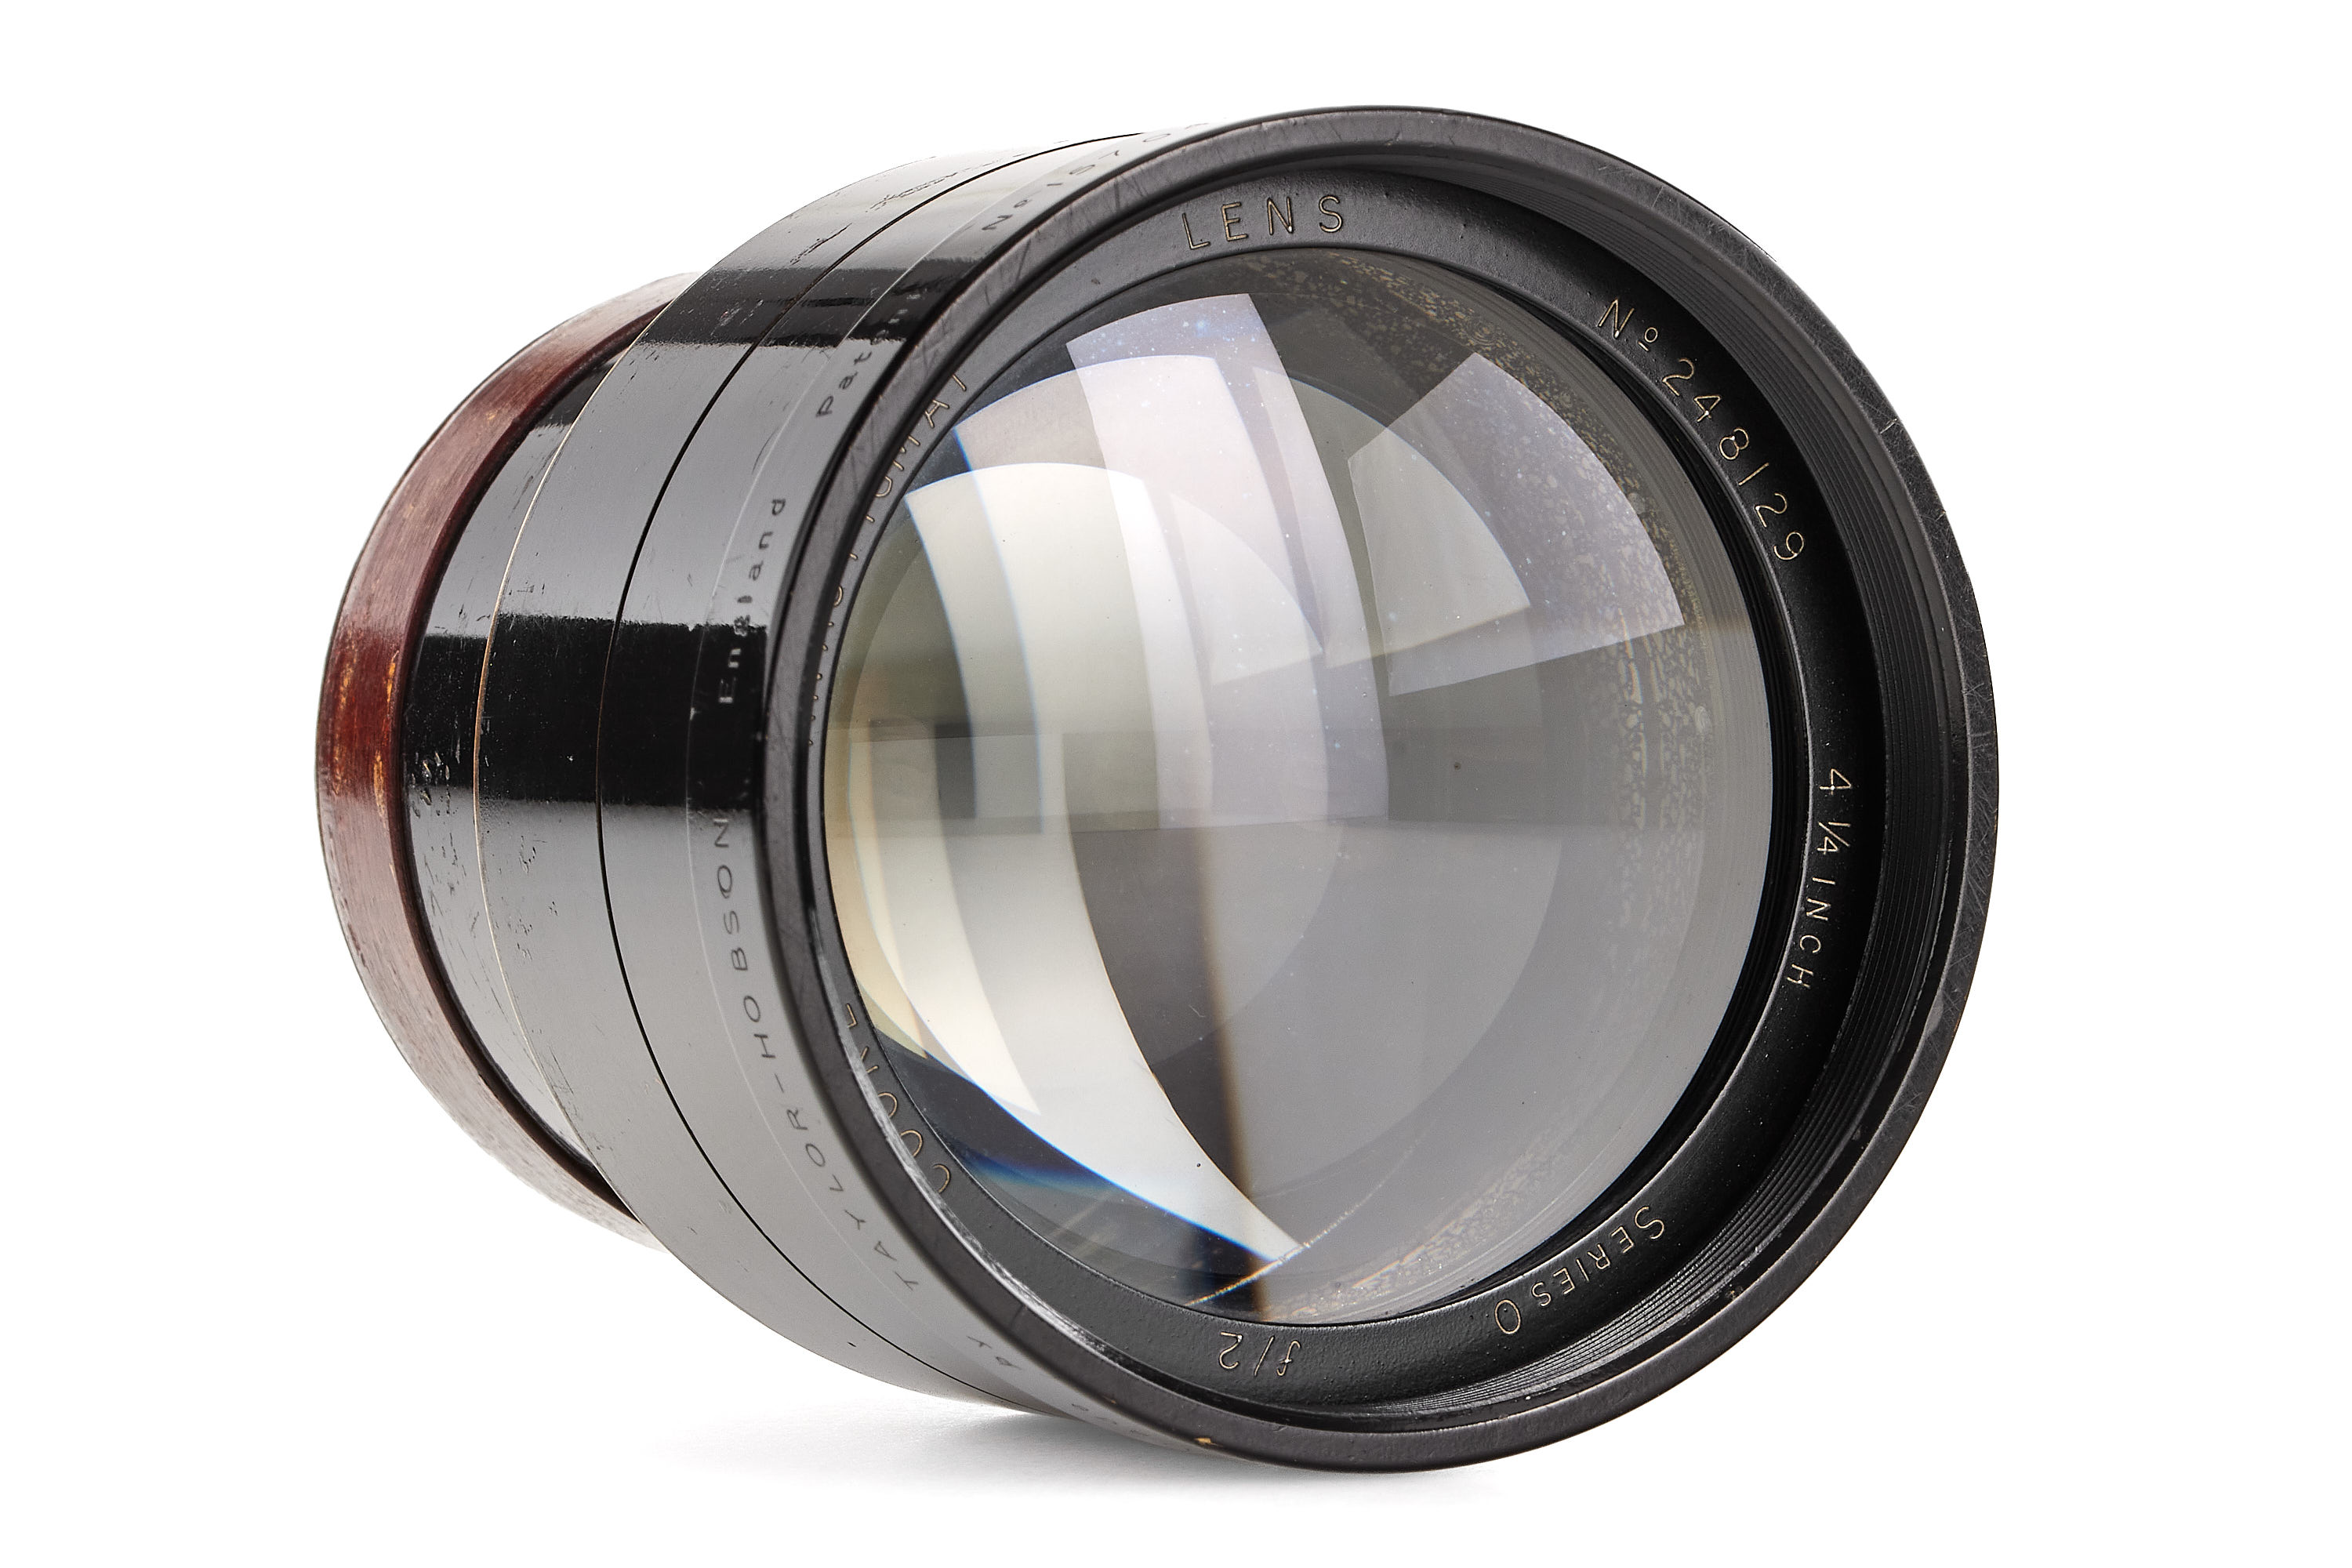
The Taylor-Hobson Cooke Anastigmat that made €1,320 in 2014. A decade later it took €10,800.
The Taylor-Hobson Cooke Anastigmat that made €1,320 in 2014. A decade later it took €10,800.Leitz Photographica

Every one of those was held for years. Between them they cover minus forty-three per cent and plus seven hundred. Any of the five would make a convincing anecdote, and each would prove something different.

Which is why we counted.

The belief being tested

Underneath most camera collecting sits an assumption that mostly goes unexamined: hold the thing long enough and it will be worth more.

It is not a mad assumption. Prices for collectable cameras have risen over the past twenty years, sometimes steeply. But "prices have risen" and "your camera will make you money if you wait" are different claims, and only the second one matters when you are deciding whether to sell.

Comparable sales cannot settle it. Two Leica M3s in the same condition fetch different sums for reasons nobody records. What you want is the same physical object, sold twice, with everything else held constant.

Leitz Photographica publishes its results in full. Reading them back to 2005 gives 113 ordinary cameras that came back to the same rooms and sold both times — same serial number, same description, years apart.

This is an unusual way to look at a collectables market, and as far as we can tell nobody has done it here before. Price guides average across different examples of the same model. Indices track what a category did. Neither can tell you what happened to an object. Repeat sales of the identical thing are how housing economists measure house prices, for exactly this reason — and an auction house that publishes serial numbers makes the same method possible for cameras.

It also produces a small sample, which is the trade. There are only 113 of them.

The typical outcome barely moves

Sort those 113 by how long the owner held on:

HeldCamerasMedian result
Under a year30+6%
One to three years29−8%
Three to six years26−12%
Six years or more28+28%

Read that column top to bottom and it does not behave. Up, down, down, then up. If waiting reliably raised the typical outcome, this is where it would show, and it does not.

We could stop there and report that patience does nothing. Several things in the same table say otherwise.

The odds behave very differently from the middle

Alongside each median, count how many cameras gained heavily against how many fell heavily:

HeldGained 50%+Lost 20%+Large gains per large loss
Under a year390.33
One to three years4110.36
Three to six years1081.25
Six years or more851.60
Under a year0.33One to three years0.36Three to six years1.25Six years or more1.60

Large gains for every large loss, by holding period. Above the dashed line, good outcomes outnumber bad ones.

That climbs steadily, and it is the only thing in this data that does.

Sold inside a year, a camera was three times more likely to fall by a fifth than to gain by half. Held past six years, it was more likely to gain than to lose. The odds swing by about five to one across the range.

What is actually happening

The shape underneath explains why the middle stays still while the odds move.

The floor barely shifts. In every band, the worst quarter of outcomes lands between 71% and 85% of what was paid. Waiting did not make bad results less bad.

The ceiling rises. The best quarter climbs from 1.34 in the first year to 1.63 past six.

Put formally: the chance of a large gain rises with holding time, and the chance of a large loss does not fall. Fitting each against holding time separately, the gain relationship is the stronger of the two by a wide margin, and it is the only one that reaches conventional significance.

So the honest sentence is not "waiting pays". It is:

Waiting does not protect you from losing. It buys you a chance of winning.

Which is a smaller claim than collectors usually make, and a more useful one.

What we cannot say

We are going to be blunt about the limits, because they are real.

The sample is small. One hundred and thirteen objects is enough to see a large effect and not enough to settle a modest one. Everything below follows from that.

The overall correlation is weak. Across all 113 objects, the relationship between holding time and outcome has a rank correlation of 0.15 — about 2% of what happened to these cameras. Ninety-eight per cent is something else: which camera, which year, who was in the room.

Its confidence interval touches zero. Resampling the 113 objects ten thousand times puts that correlation between about −0.03 and +0.32. Around 95% of those resamples came out positive, which is suggestive and is not proof.

The strongest single result is marginal. The rise in the chance of a large gain has a z of 2.2. That clears the usual bar, but only just, and we chose the "large gain" threshold ourselves.

What holds up best is the consistency. We tested every possible place to cut the data — 73 of them, from a few months to sixteen years. In all 73, the longer-held group had better odds than the shorter-held group. Not most. All. And no single object drives it: removing any one of the 113 moves the correlation by less than 0.03.

A weak effect that points the same way every time you look at it is not nothing. It is also not settled.

What a collector should take from this

If you are buying a camera and telling yourself it is an investment, this data does not support that in the way you would like. The middle of this market is noisy, and your camera's fate is mostly about your camera.

What the numbers suggest — gently, without insisting — is that time changes the shape of the bet rather than its centre. It does not make the downside smaller. It makes the upside more likely to happen to you.

The Contax that lost sixteen per cent over sixteen years and the Cooke that made seven hundred over ten were both held patiently. Only one was rewarded, and nothing in the catalogue entry would have told you which.

So, as plainly as the evidence allows:

Over 113 cameras and twenty-one years, holding longer did not raise the typical result. It did raise the chance of an unusually good one, while leaving the chance of a bad one about where it was. The effect is modest, the sample is small, and the direction has been consistent every way we have cut it.

We will check again

This question answers itself with time. Leitz holds two sales a year, and each adds a handful of cameras that have been through these rooms before. The traceable population grows by ten or fifteen a year.

At around two hundred objects, a correlation of 0.15 becomes something you can settle rather than argue about. That is roughly six years away — which is, pleasingly, about the holding period this piece is uncertain about.

Other records would help sooner. Houses elsewhere publish results the same way, and a second archive of comparable depth would nearly double the sample overnight. We are looking.

Until then, this is what the evidence says, including the parts that do not cooperate.

Figures with a dotted underline link to the auction house's own record of that sale — the lot, the date and the price as published. Every number in this piece comes from a completed sale we can point at.
How we know

The source. Leitz Photographica's own published results, Vienna, 2005 to 2026. An object counts when the same serial number appears in two separate sales with a matching description, having sold on both occasions.

Why Leitz alone. Our other source, Flints in the UK, has published since 2017, so no object it has sold can yet show a long hold. Including it would load the short-hold group with one house's results and the long-hold group with another's — and the difference between the houses would then appear as a finding about patience. It nearly did: with Flints included, short holds looked markedly worse than they do here. That comparison is not available to us and we have not made it.

Exclusions. Catalogue placeholder serial numbers; codes that are only a date, since Leitz sometimes records "c.1954" where a serial belongs and a year cannot identify a camera; multi-item lots; cases where two different cameras share a number; pairs whose contents changed between sales; and any sale exceeding four times its own top estimate, which is an event rather than a price. These are the same filters our other pieces use, so re-running them produces the same answer.

Prototypes and rare finishes are excluded. The catalogue flags them, they behave differently, and 113 ordinary cameras is a cleaner question than 145 mixed ones. One caveat on that: our classifier reads the catalogue's own words, so an object the cataloguer described in ordinary language stays in. The Taylor-Hobson Cooke that opens this piece is a 1914 lens of some rarity, and it counts as ordinary here because nothing in its entry said otherwise.

Three things this method cannot see, and one it assumes.

It is a repeat-sales design, which is its strength and its constraint. Comparing an object against itself removes almost every confound that troubles a price index — model, condition, specification, the whole question of whether two examples are really alike. What it cannot do is observe objects that never come back. Everything here describes cameras that returned to auction, and those are not a random sample of cameras.

An object only reappears because somebody chose to sell it. People sell for reasons — a collection broken up, a death, a change of interest, occasionally a belief that the moment is right. If that last one is common, the objects we can see are tilted towards owners who thought they would do well, and our figures are correspondingly optimistic. We cannot measure this and we do not know its size.

The gap between two sales is not necessarily one owner's holding period. We observe two auction appearances. A camera may have changed hands privately in between, more than once. What we are really measuring is time off the auction market, which is the closest available proxy for patience and is not the same thing.

And this is one market period. 2005 to 2026 was, broadly, a rising market for collectable cameras. A relationship that holds through a long expansion need not hold through a contraction, and this archive contains no real example of one.

Brands are pooled, and we checked whether that hides anything. The 113 objects run from Leica to Foca to Alpa to a Tower 46, and the analysis treats them as one population. Leica is the name most people would ask about, so we split it out: 32 of the 113 are Leica or Leitz, and their median outcome was 0.92 against 1.06 for everything else — slightly worse, not better.

That is not a finding about Leica. It is a finding about how Leicas are traded. Twenty-five of those 32 were held under three years, against 34 of 81 for everything else: Leicas turn over faster, and short holds do worse. Once holding period is accounted for, the two groups behave almost identically — the odds of a large gain against a large loss improve from 0.33 to 1.36 for the non-Leicas and from 0.36 to 1.50 for the Leicas.

That agreement is worth something as a replication, but not much: the Leica long-hold group is seven objects. We report it as directional support, not as a second independent test. Nothing here should be read as a claim about how any particular marque performs.

The statistics.

Correlation. Spearman rank correlation between holding days and outcome ratio: rho = 0.154 on 113 objects. A bootstrap over 10,000 resamples gives a 95% interval of roughly −0.03 to +0.32, with about 95% of resamples positive. Those bounds are quoted rounded because a bootstrap is itself random: repeating the whole procedure twenty times moved the lower bound between −0.030 and −0.022 and the upper between 0.320 and 0.328. A reader re-running it should expect something close to these figures, not identical ones. Leave-one-out fits range from 0.133 to 0.177, so no single object is responsible. Trimming the five most extreme outcomes at each end drops rho to 0.080, which tells you the relationship lives in the tails rather than the middle — consistent with everything else here.

Probability of a large outcome. Logistic regressions of outcome against the natural log of holding years. For a gain of 50% or more (25 of 113 objects): slope 0.582, standard error 0.264, z = 2.20 — the odds of a large gain multiply by about 1.8 for each e-fold increase in holding time. For a loss of 20% or more (33 objects): slope −0.190, standard error 0.218, z = −0.87, which is indistinguishable from no relationship.

Threshold sensitivity. We chose those thresholds, so we tested others. Across gain thresholds from 1.2× to 2.0×, the slope is positive at every one, ranging from 0.30 to 0.99, with z between 1.28 and 2.20. The direction is robust; the significance is not uniform. Across loss thresholds from 0.70 to 0.90 the slope stays near zero and changes sign, which is what a genuine null looks like.

What we have not done. We have not corrected for testing two outcome models, and the boundaries in the four-band table were chosen for legibility rather than pre-registered. Treat the z of 2.20 as "large relative to the noise" rather than as a probability that we are wrong. The 73-split consistency is reported as a description of the data, not as 73 independent tests: nested splits are not independent of one another.

Prices are as published by the house, in euros, and each object is compared only against itself. Leitz publishes hammer prices inclusive of the buyer's premium, so a seller received less than these figures at both ends — which makes every outcome here slightly flattering.

Figures are nominal, not adjusted for inflation. Over a sixteen-year hold that matters, and a reader wanting a real return should apply their own.

Glass Hound 🐾 On the Scent 📄 The Paper Trail 📸 @glasshoundphoto Feedback & contact Privacy